Get Started
First create a compressed representation of a distribution:
import numpy as np
import distogram

distribution = np.random.normal(size=10000)

# Create and feed distogram from distribution
# on a real usage, data comes from an event stream
h = distogram.Distogram()
for i in distribution:
    h = distogram.update(h, i)
Compute statistics on the distribution:
nmin, nmax = distogram.bounds(h)
print("count: {}".format(distogram.count(h)))
print("mean: {}".format(distogram.mean(h)))
print("stddev: {}".format(distogram.stddev(h)))
print("min: {}".format(nmin))
print("5%: {}".format(distogram.quantile(h, 0.05)))
print("25%: {}".format(distogram.quantile(h, 0.25)))
print("50%: {}".format(distogram.quantile(h, 0.50)))
print("75%: {}".format(distogram.quantile(h, 0.75)))
print("95%: {}".format(distogram.quantile(h, 0.95)))
print("max: {}".format(nmax))
count: 10000
mean: -0.005082954640481095
stddev: 1.0028524290149186
min: -3.5691130319855047
5%: -1.6597242392338374
25%: -0.6785107421744653
50%: -0.008672960012168916
75%: 0.6720718926935414
95%: 1.6476822301131866
max: 3.8800560034877427
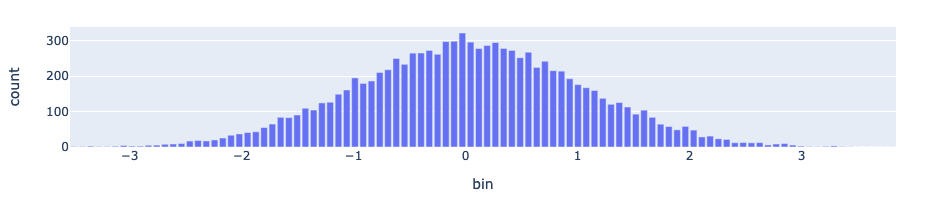
Compute and display the histogram of the distribution:
hist = distogram.histogram(h)
df_hist = pd.DataFrame(np.array(hist), columns=["bin", "count"])
fig = px.bar(df_hist, x="bin", y="count", title="distogram")
fig.update_layout(height=300)
fig.show()